
22 min read
24 Customer Engagement Strategies that Keep Guests Longer
Loyal customers return more often and shape how restaurants and c-stores grow. They: Visit more Spend more Tell others A successful...
5 min read
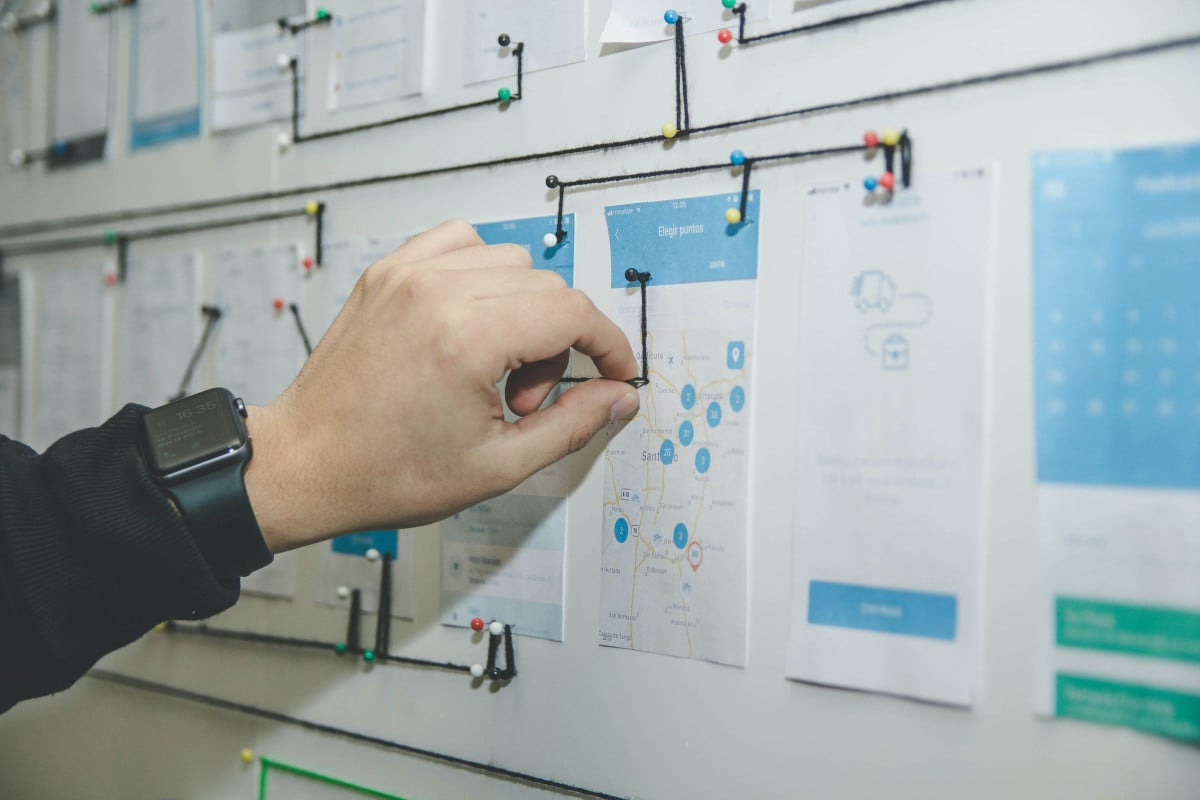
Most businesses struggle because they don't have a clear view of the user journey. That makes it hard to know where:
Engagement drops
Personalization breaks down
There are missed revenue chances
Disconnected systems limit visibility. Without a view of the marketing channels, teams rely on assumptions instead of customer insights.

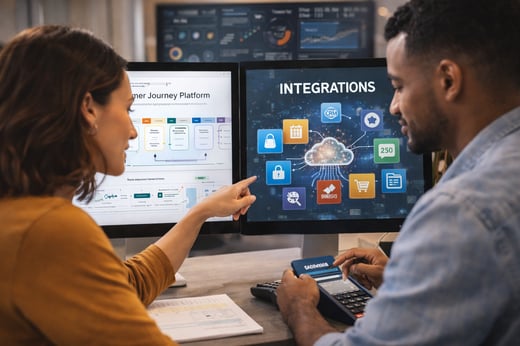
Modern customer journey software solves this. It does it by getting data into a single view. But using the right data leads to happier customers.
These platforms connect:
Ordering
This article explores eight software features that influence how your guests:
Move
Decide
Spend
These automated tasks react instantly to what users do while their intent is still high. This provides insights that lead to better service decisions and increased spend.
Data tools spot patterns that humans often miss. A dessert abandonment recovery campaign can send an offer when a guest adds dessert but leaves before checkout.
Trigger messaging can help brands get a 15%–20% spend increase from upsell messages. These work because they arrive during decision moments when the customer is still ready to buy.
Examples

Some guests start increasing their spend after only a couple of visits. Others don't. Predictive spend modeling shows these early signals. That lets teams spot respond before revenue opportunities slip away.
Predictive models mix data and customer profiles to create future value and spot opportunities early.
The real cost of losing a customer without noticing. These systems catch spending decline before they become a habit:
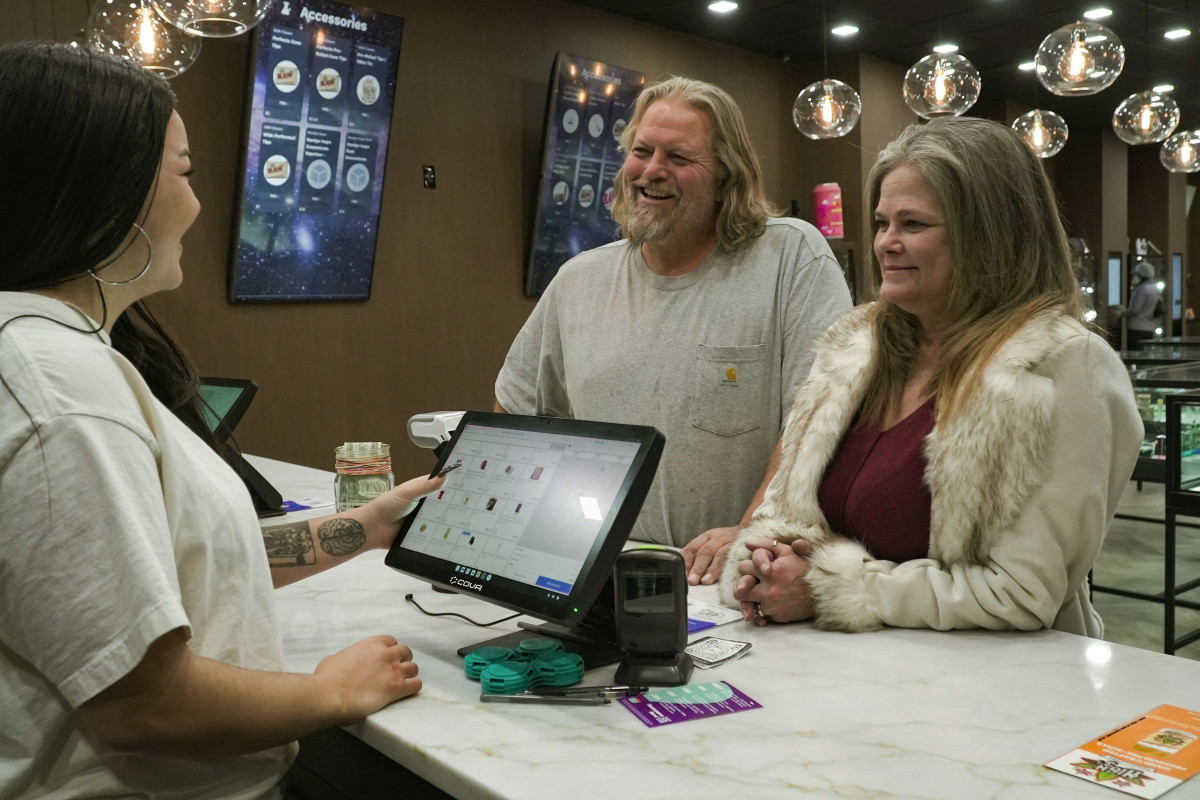
Personalization engines matter because customers buy experiences. Paytronix uses customer research and data to create personal journeys in real time.

When customers switch between ordering online, using a QR code, or visiting in-store, it should feel the same. Cross-channel journey organizes the messages.
This feature brings customer data into one place by connecting:
POS
Social engagement
CRM
It helps teams understand channel usage.
Paytronix supports this by centralizing the journey view. This makes it easier to act on real behavior.
A restaurant might notice that guests who use mobile ordering are not returning to dine in. They could start a marketing campaign with offers sent by:
App notifications
In-store offers
Consistent messaging matters because customers notice when the story changes. If a guest sees a promo on social media, then gets a different offer by email, it decreases trust. When messages align, average ticket sizes may increase by 20-25%.
Breaking down data allows the entire team to stay focused. When everyone can track it, teams build marketing promotions that improve revenue.
A smart upsell system uses customer behavior and orders to suggest add-ons. The goal is to increase revenue by offering helpful choices, not by pushing extra items.
ML knows:
Purchase history
Basket choices
Time of day
Repeat behavior
It uses it to predict what a guest is most likely to add next. In restaurants, this can mean suggesting dessert after dinner or upgrading a guest’s drink.
The most common models find patterns among similar guests. Classification models score each offer based on its likelihood to convert. Use these to improve recommendations.

Upsell recommendations are more accurate when they use factors like:
Order type
Guest segment
Location
A platform may suggest a dessert only when the order is for dine-in, or offer a larger drink to a customer who often chooses upgrades.
AI chatbots can deliver these suggestions during ordering. This increases add-on rates because the recommendation arrives when the guest is already deciding.
Effective upsells offer helpful suggestions based on customer behavior. This improves customer happiness while driving revenue.
Instead of using spreadsheets, these dashboards turn user behavior into clear visual stories. Data visualization shows the full customer path in one place.
This feature creates user journey maps that show how customers interact across channels. Heat maps reveal spending triggers, such as loyalty members switching from lunch to dinner.
Funnel reports show the moments guests leave, such as abandoning checkout after selecting add-ons. Drag-and-drop dashboards make it easy for teams to move from insight to action.

When your customer journey includes digital channels and in-store visits, small changes make for big results. Testing frameworks let restaurants run experiments across:
POS
Reservation systems
These test:
Offers
Messages
Menu layouts
Then it chooses the best version based on real user behavior. Guests often behave differently across channels, like choosing more snacks on mobile apps and more full meals in-store.
Testing is needed because customer behavior differs across:
Websites
Multiple channels
It reveals the best combinations of:
Timing
Offer
Channel
Winner identification means the platform notes the highest-performing option and uses it across the journey. Restaurants that use this see higher average checks and more repeat orders.
How you use it with your other systems is where a customer journey platform either becomes a growth engine or another dashboard. If the platform can’t connect to data, the full strategy doesn't work.
Once you understand the features, the next step is using them. The goal is to turn customer insights into actions:
A 60- to 90-day ROI timeline often includes:
Improved targeting
Higher campaign response rates
Better upsell performance
When teams make decisions from real customer feedback tools and data integrations, the platform becomes a part of the operation.

These FAQs explain how teams:
Visualize interactions
Use journey insights
Manage customer journeys
The five stages are:
Awareness
Consideration
Purchase
Retention
Advocacy
Mapping these helps teams to:
See customer actions
Spot pain points
Improve experiences
It lets teams create customer journey maps that show:
Interactions
Emotions
Decisions
These customer tools support:
Journey data
Collaborative features
Visibility into service blueprints
It outlines the stages of customer decision-making, including:
Aware
Appeal
Ask
Act
Advocate
It is often used to:
Find pain points
Understand customer groups
Align strategy
Yes. Many platforms have apps that visualize customer paths. These tools combine:
Project management
Insight collection
journey insights
Start by focusing on a single part of the customer journey and making it work well before adding more. This keeps the project manageable.
Select features based on gaps found during customer journey mapping. Creating personas clarifies the different customer types.
Review the customer journey map using:
Customer feedback tools
Sticky notes
Stakeholder maps
Want to learn where to start? Book a demo with Paytronix. Download our Restaurant Economic Insights Mini Guide to learn what top restaurant brands do every month.


22 min read
Loyal customers return more often and shape how restaurants and c-stores grow. They: Visit more Spend more Tell others A successful...

10 min read
AI marketing drives growth across the board, from a food truck using key AI marketing tools, such as social media support and data reports, to...
21 min read
Top restaurants and convenience stores create customer experiences (CX) that turn one-time visitors into loyal advocates. To achieve this, brands...